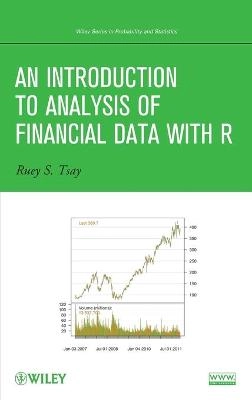
An Introduction to Analysis of Financial Data with R; Ruey S. Tsay; 2012
endast ny

An Introduction to Analysis of Financial Data with R Upplaga 1

av Ruey S. Tsay
A complete set of statistical tools for beginning financial analysts from a leading authority

Written by one of the leading experts on the topic, An Introduction to Analysis of Financial Data with R explores basic concepts of visualization of financial data. Through a fundamental balance between theory and applications, the book supplies readers with an accessible approach to financial econometric models and their applications to real-world empirical research.

The author supplies a hands-on introduction to the analysis of financial data using the freely available R software package and case studies to illustrate actual implementations of the discussed methods. The book begins with the basics of financial data, discussing their summary statistics and related visualization methods.Subsequent chapters explore basic time series analysis and simple econometric models for business, finance, and economics as well as related topics including: * Linear time series analysis, with coverage of exponential smoothing for forecasting and methods for model comparison * Different approaches to calculating asset volatility and various volatility models * High-frequency financial data and simple models for price changes, trading intensity, and realized volatility * Quantitative methods for risk management, including value at risk and conditional value at risk * Econometric and statistical methods for risk assessment based on extreme value theory and quantile regression

Throughout the book, the visual nature of the topic is showcased through graphical representations in R, and two detailed case studies demonstrate the relevance of statistics in finance. A related website features additional data sets and R scripts so readers can create their own simulations and test their comprehension of the presented techniques.

An Introduction to Analysis of Financial Data with R is an excellent book for introductory courses on time series and business statistics at the upper-undergraduate and graduate level. The book is also an excellent resource for researchers and practitioners in the fields of business, finance, and economics who would like to enhance their understanding of financial data and today's financial markets.
Upplaga: 1a upplagan
Utgiven: 2012
ISBN: 9780470890813
Förlag: John Wiley & Sons
Format: Häftad
Språk: Engelska
Sidor: 420 st
A complete set of statistical tools for beginning financial analysts from a leading authority

Written by one of the leading experts on the topic, An Introduction to Analysis of Financial Data with R explores basic concepts of visualization of financial data. Through a fundamental balance between theory and applications, the book supplies readers with an accessible approach to financial econometric models and their applications to real-world empirical research.

The author supplies a hands-on introduction to the analysis of financial data using the freely available R software package and case studies to illustrate actual implementations of the discussed methods. The book begins with the basics of financial data, discussing their summary statistics and related visualization methods.Subsequent chapters explore basic time series analysis and simple econometric models for business, finance, and economics as well as related topics including: * Linear time series analysis, with coverage of exponential smoothing for forecasting and methods for model comparison * Different approaches to calculating asset volatility and various volatility models * High-frequency financial data and simple models for price changes, trading intensity, and realized volatility * Quantitative methods for risk management, including value at risk and conditional value at risk * Econometric and statistical methods for risk assessment based on extreme value theory and quantile regression

Throughout the book, the visual nature of the topic is showcased through graphical representations in R, and two detailed case studies demonstrate the relevance of statistics in finance. A related website features additional data sets and R scripts so readers can create their own simulations and test their comprehension of the presented techniques.

An Introduction to Analysis of Financial Data with R is an excellent book for introductory courses on time series and business statistics at the upper-undergraduate and graduate level. The book is also an excellent resource for researchers and practitioners in the fields of business, finance, and economics who would like to enhance their understanding of financial data and today's financial markets.
Ny bok
1637 kr1723 kr
5% studentrabatt med Studentapan
Begagnad bok (0 st)
Ny bok
1637 kr1723 kr
5% studentrabatt med Studentapan
Begagnad bok (0 st)